
Your GPU hits 85C mid-match. Panic or shrug? Your CPU kisses 95C in a render. Broken cooler or designed behavior?
Generic “stay under 80C” advice fails modern silicon. Chip-specific walls of specs fail people who just want to know if tonight’s numbers are fine.
Modern CPUs and GPUs are designed with thermals in mind. The reason a laptop with an RTX 5070 behaves very differently from a desktop using the same card is thermals: heat. On a desktop PC there is no danger of melting either of these components, since the factory safeguards will cut power to the system before any damage can take place in most cases. The danger here is instability and performance cuts. Those same safeguards already start their work way before the alarms are raised, in the form of limiting power to the component that is on its way to a higher than normal temperature.
Last verified: September 12, 2026. Use HWiNFO64 sensors-only for truth. Add MSI Afterburner + RTSS when you want numbers on screen. Keep tools updated on RTX 50 systems so hotspot and related sensors actually show up.
Tools worth installing
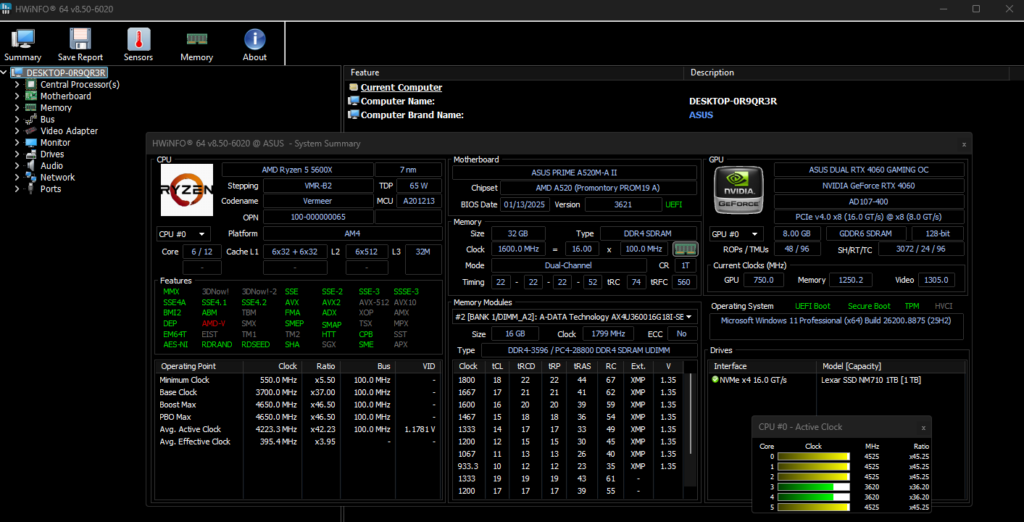
HWiNFO64 is the keep-forever tool. Package temp, cores, CPU hotspot where available, GPU average, GPU hotspot, VRAM, VRMs, fans, power. Sensors-only mode is the clean table.
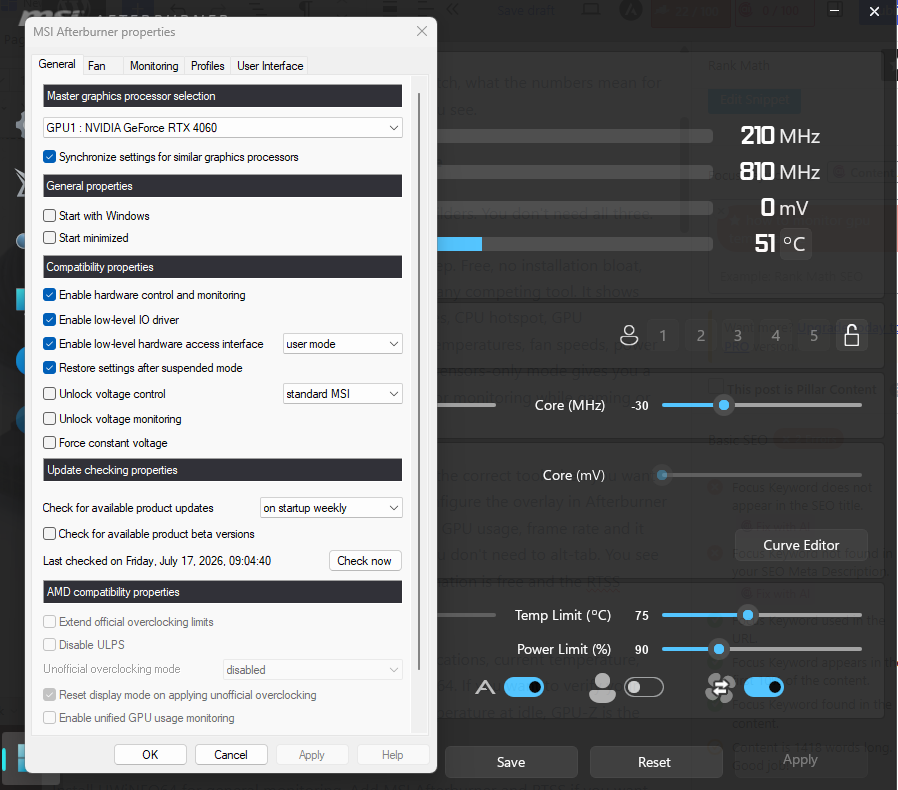
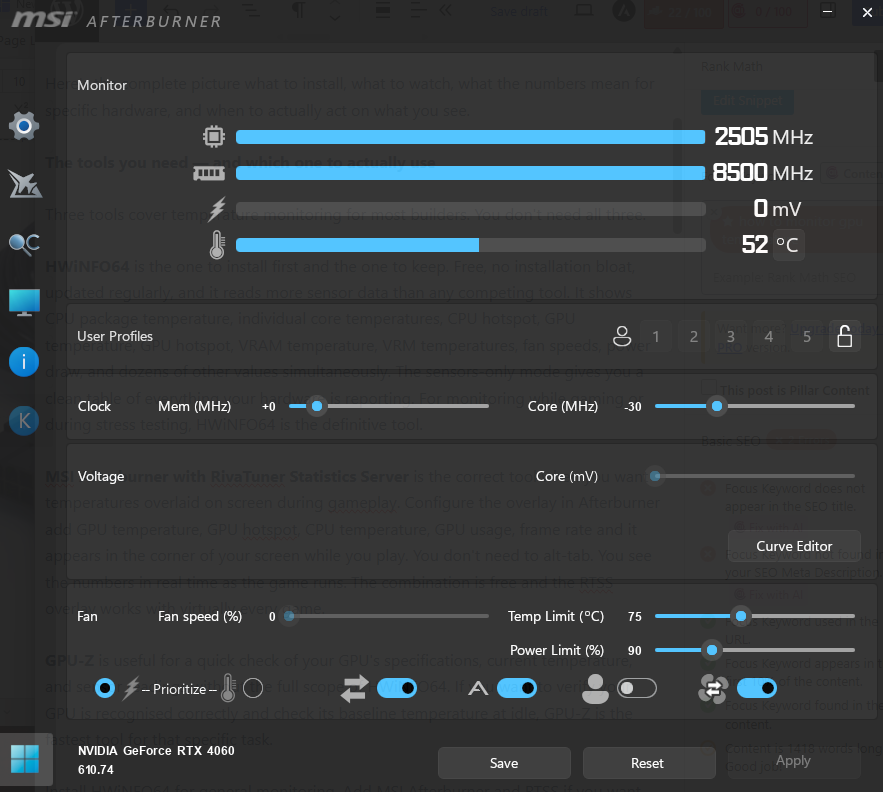
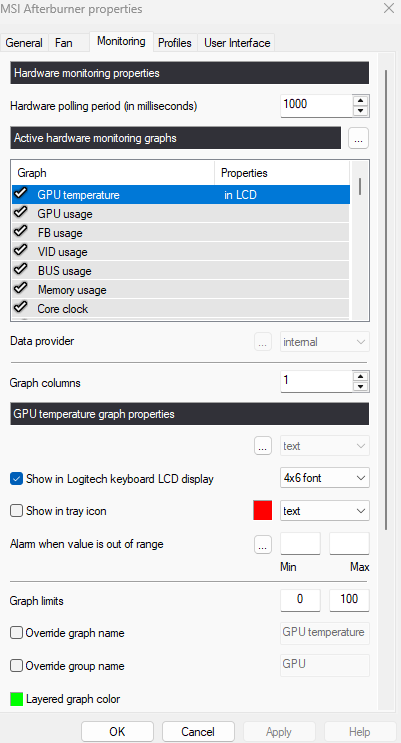
MSI Afterburner + RivaTuner Statistics Server is the in-game overlay. Tick GPU temp, hotspot, CPU temp, GPU usage, FPS. No alt-tab required.
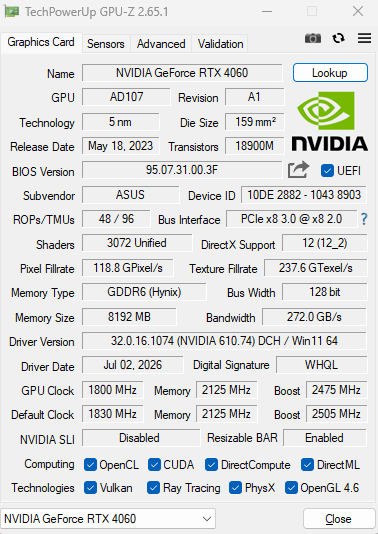
GPU-Z is the quick identity and idle sanity check. Not your all-night logger.
Install HWiNFO first. Add Afterburner only if you want the overlay. Stop collecting utilities after that.
CPU temperatures: hot can be normal
Modern CPUs boost into their thermal ceiling on purpose. Seeing high load temps is not automatically failure.
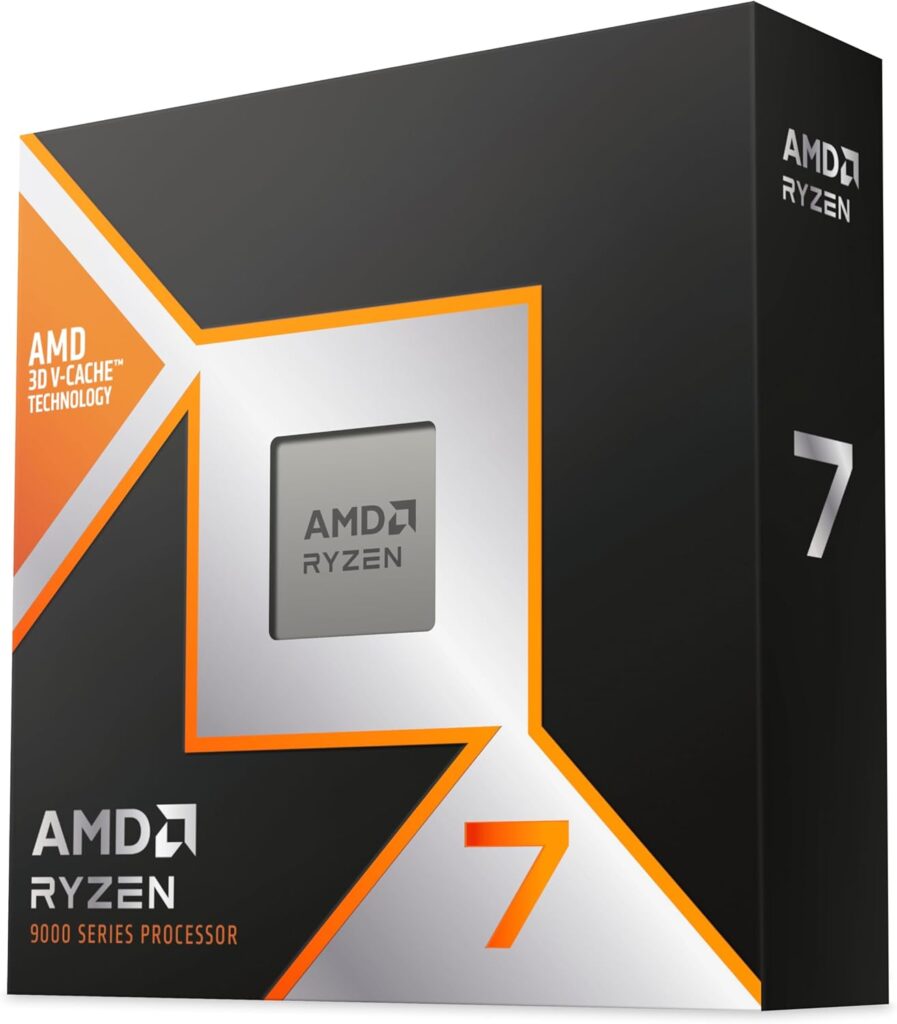
Ryzen 9000 non-X3D: TJMax around 95C is common. All-core renders sitting in the 90s can be normal. Gaming often lands ~70-85C with a decent cooler.
9800X3D / X3D: AMD lists the Ryzen 7 9800X3D’s maximum operating temperature (Tjmax) as 95C on its official spec page, the same ceiling as the regular Ryzen 9000 chips. The 89C figure you’ll still see in some guides belongs to the older 7800X3D, where the cache sat on top of the cores. Gaming temps usually sit well below it. Treat sustained hits at that ceiling under light gaming as a cooler/mount/airflow check, not a flex.
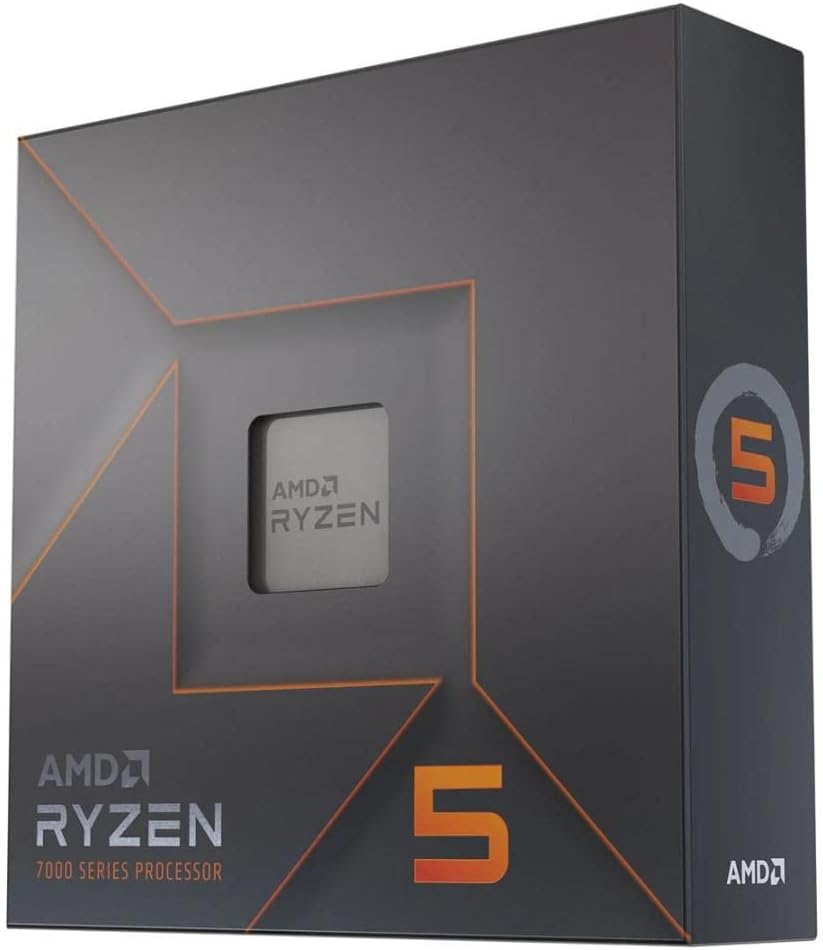
Ryzen 7000: same story as Zen 4 non-X3D, 95C TJMax behavior under heavy sustained work.
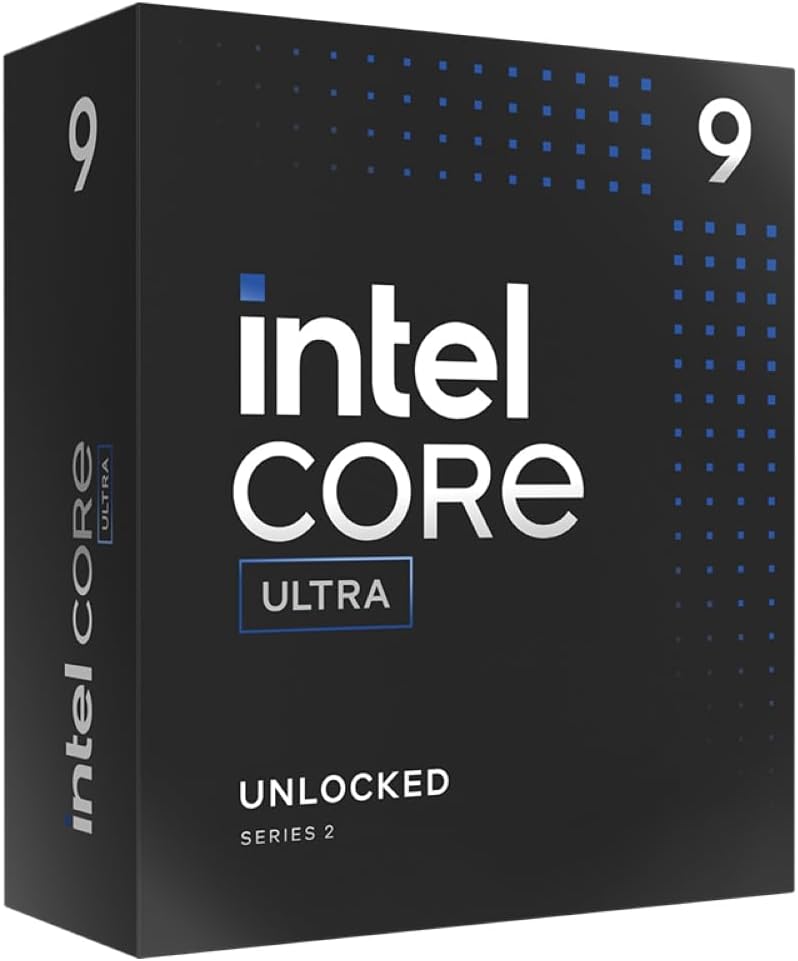
Intel Core Ultra 200S: TJMax near 100C. Gaming often ~60-80C. Wild productivity spikes deserve a look at BIOS power limits before you blame the air cooler.
Watch package / Tdie as the primary number. Per-core spikes happen. Package is the protection story.
If gaming alone pins you at TJMax while frames fall over, something is wrong. Paste, mount pressure, case airflow. Do that before you buy a bigger cooler on vibes.
GPU temperatures: average vs hotspot
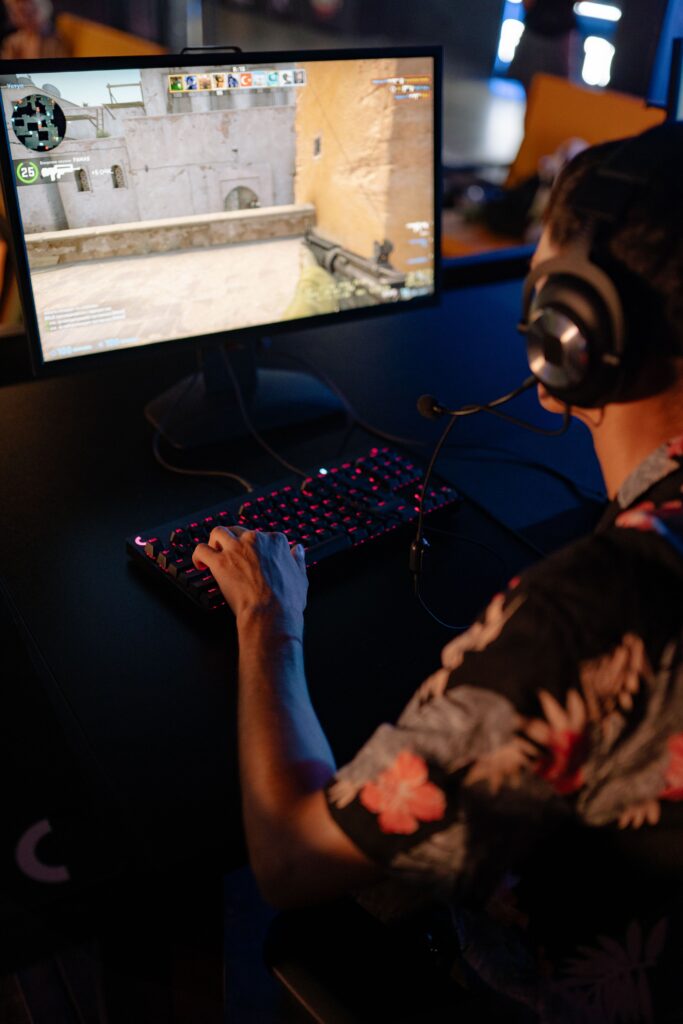
GPU average is the number people quote. Many RTX 50 cards sit ~65-83C in real games with sane case airflow. Community snapshots on 5070-class cards often cluster even cooler when the cooler and case cooperate.
GPU hotspot is the hottest point on the die. Expect it 15-25C above average. A 72C average with a ~90C hotspot is ordinary, not a death rattle. On current Nvidia 50-series cards, junction/throttle figures are commonly cited near ~107C. Stay meaningfully under that in normal play.
Hard limit: never judge an RTX 50 card by average temperature alone if hotspot is missing from your overlay. Update HWiNFO (and related tools). A “cool” 68C average with a hidden hotspot near throttle is how people chase FPS ghosts.
VRAM (GDDR6/GDDR7) has its own sensors. GDDR7 can run hot by design. High VRAM with a calm GPU average often means airflow over the memory side is trash, or old pads on a tired cooler.
Quick reference ranges
| Component | Idle | Gaming load | Act now |
| Ryzen 9000 non-X3D | 35-50C | 70-90C | Stuck at ~95C in light gaming |
| Ryzen 9800X3D | 35-50C | often 65-80C | Sustained at ~95C ceiling in light gaming |
| Intel Core Ultra 200S | 30-45C | 60-80C | Unexpected near-100C in mild loads |
| GPU average (RTX 50) | 30-45C | 65-83C | Sustained 87C+ with FPS wobble |
| GPU hotspot (RTX 50) | 45-65C | 80-95C | Approaching ~105-107C |
| VRAM (GDDR7) | 40-55C | 70-95C | Pushing past ~100-105C |
Overlay setup that takes five minutes
Afterburner → Settings → Monitoring → enable OSD on GPU Temperature, Hotspot, CPU Temperature, GPU Usage. RTSS on. Launch a game. Read numbers after 20 to 30 minutes, not in the first loading screen.
When to act

CPU 90-94C in a heavy game on non-X3D Ryzen: often fine if clocks hold. CPU glued to TJMax with stutter: paste, mount, airflow. GPU average 87C+ sustained with frame pacing mess: dust, fan curve, case intake. Hotspot near ~105C+: investigate now even if average looks polite. VRAM past ~100C: improve GPU-side airflow or plan a pad/paste service on older cards.
Inside the normal bands? Do nothing. Monitoring catches slow creep before you invent a $400 GPU problem that was a $0 dust problem.
SpecClear participates in affiliate programmes. When you purchase through links on this site, we may earn a commission at no extra cost to you.