Most PC problems that show up as stuttering, frame drops, or crashes have a cause. That cause has a number associated with it. Temperature too high. VRAM maxed out. One CPU core at 100% while the GPU waits. The problem is that most players never look at those numbers while the game is running so they replace hardware they don’t need to replace, or live with problems that a two-minute setting change would fix.
This guide covers the free tools that put those numbers on your screen while you play, what each reading means in plain language, what normal looks like, and what signals something is actually wrong. You don’t need to understand every metric all you need to understand the handful that explain 90% of performance problems.
How to Monitor PC Gaming Performance: The Four Tools Worth Knowing
Monitor your PC Before anything else, understand which tool does what. They’re not interchangeable each one has a specific strength.
MSI Afterburner + RivaTuner Statistics Server (RTSS)
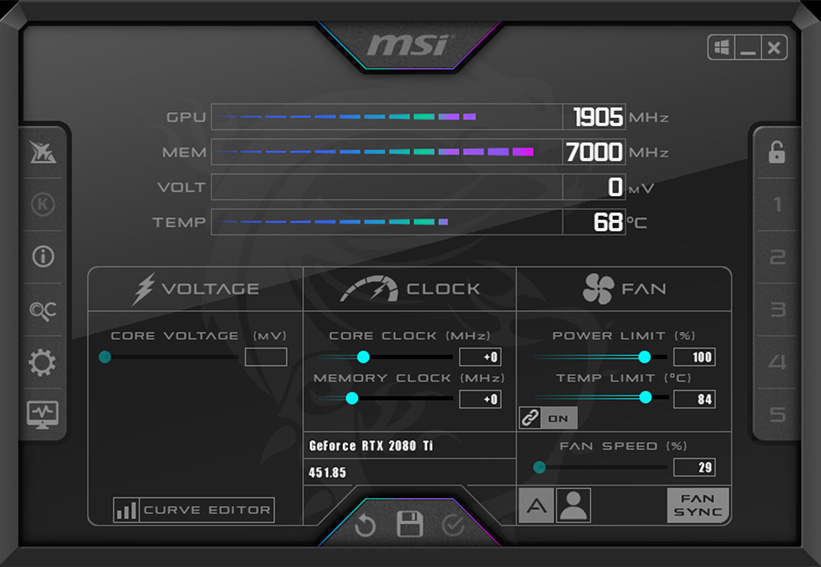
The in-game overlay standard this is the combination most PC gamers use for monitoring. Afterburner collects sensor data. RTSS draws it on your screen while you play Together they create the customisable overlay showing FPS, temperatures, GPU usage, VRAM usage, and CPU temperature over your game in real time. Download MSI Afterburner from msi.com keep RivaTuner Statistics Server checked during the installation wizard. Both need to be running for the overlay to appear. Free. Works with Nvidia, AMD, and Intel Arc GPUs.
HWiNFO64
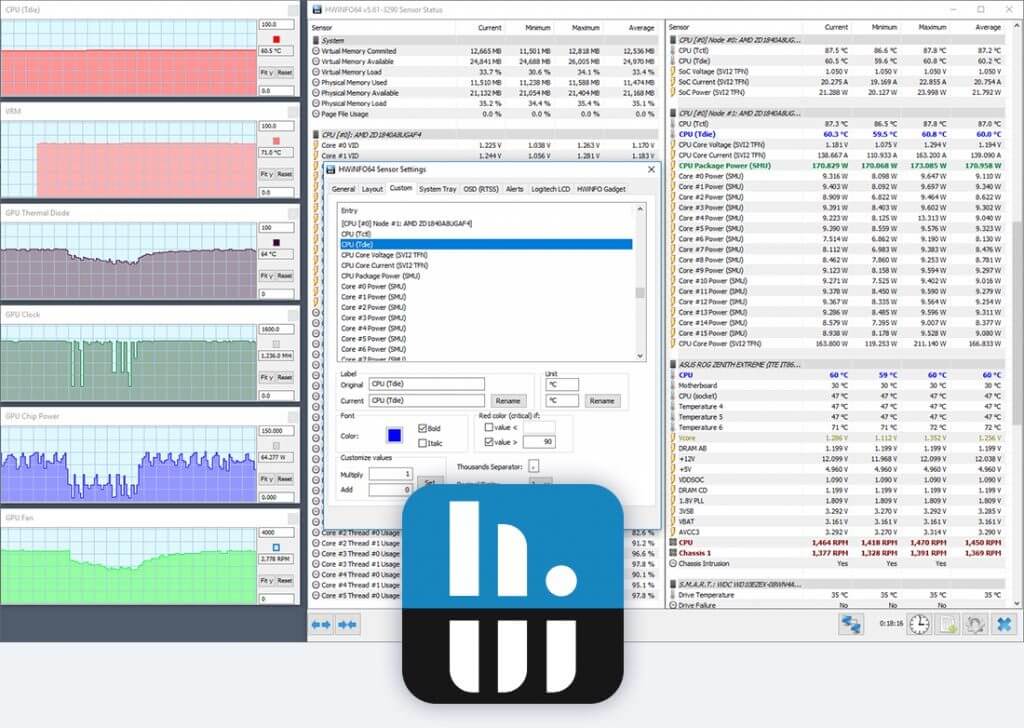
The deep diagnostic tool when Afterburner’s overlay shows something concerning and you need more detail, HWiNFO64 is where you look. It reads every sensor your hardware exposes: multiple GPU temperature sensors including hotspot and VRAM junction temperature, per-core CPU temperatures, motherboard VRM readings, dedicated throttling flags. It won’t draw an overlay itself without being paired with RTSS, but its sensor window gives you the full picture Afterburner can’t always show. Download from hwinfo.com. Free for personal use.
GPU-Z
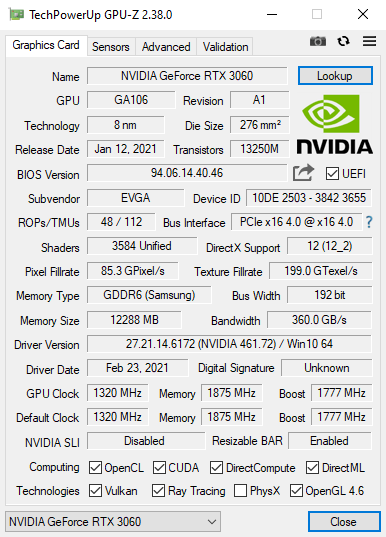
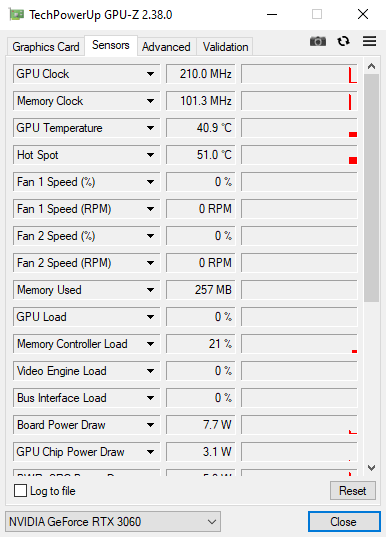
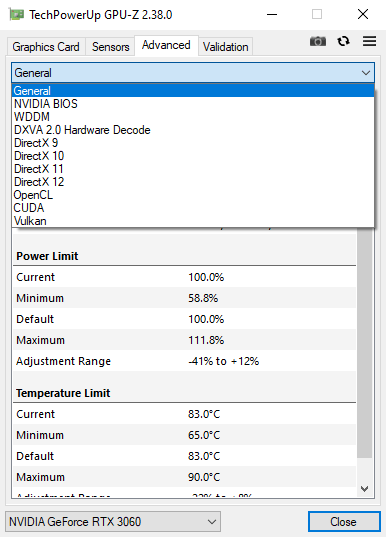
The GPU specification and quick-diagnostic tool, TechPowerUp’s GPU information utility shows your exact GPU specs and live sensor readings in a single lightweight window. It’s the fastest way to confirm your GPU is running at its rated boost clock, that VRAM is at its rated speed, and that your card is identified correctly download from techpowerup.com/gpuz Free works with all GPU brands.
CPU-Z
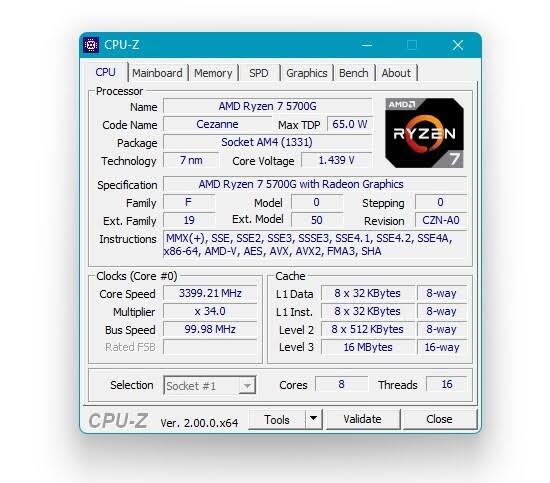
The CPU and RAM information tool. Shows your exact CPU specs, current clock speeds, core voltages, and RAM configuration. The Memory tab confirms whether XMP/EXPO is active then if it shows your RAM speed as 4800 MT/s when your kit is rated 6000 MT/s, XMP/EXPO isn’t enabled. Download from cpuid.com/softwares/cpu-z.html. Free.
Setting Up the Afterburner Overlay in 5 Minutes
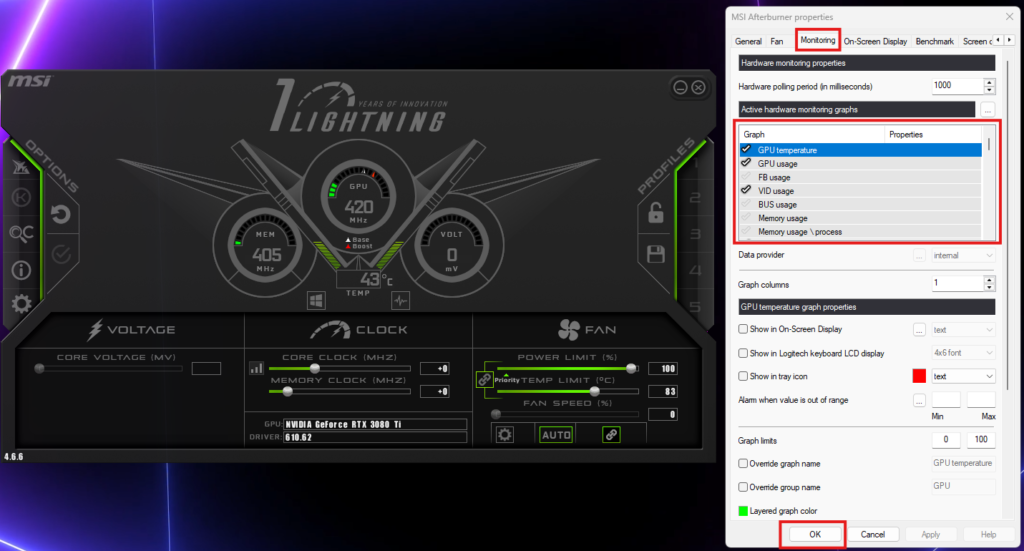
Most people install Afterburner and then wonder why nothing appears in their games. The overlay requires two things to work: the correct settings in Afterburner, and RivaTuner Statistics Server actively running in the background. Most setup guides only mention the first.
Step 1 — Enable Start with Windows for both applications. In Afterburner, click the gear icon (Settings) → General tab → tick “Start with Windows” and “Start minimized.” Open RivaTuner Statistics Server from your system tray, find its settings, and enable the same option. Both applications need to be running before you launch a game.
Step 2 — Configure what appears in your overlay. Afterburner Settings → Monitoring tab. You’ll see a long list of GPU and CPU sensors. For each metric you want visible while gaming, click it to highlight it, then tick “Show in On-Screen Display” in the properties panel below the list. Recommended starting set:
- Framerate (FPS)
- Frametime
- GPU Usage (%)
- GPU Temperature
- GPU Memory Used (MB)
- CPU Usage (%)
- CPU Temperature (Package)
Click Apply → OK.
Step 3 — Confirm RivaTuner is running. Look in the system tray at the bottom right of your screen (click the arrow to show hidden icons). Both the Afterburner icon and the RivaTuner icon should be there, If RTSS isn’t running, the overlay won’t appear regardless of what Afterburner is configured to show.
Step 4 — Set the overlay hotkey. In Afterburner Settings → On-Screen Display tab → assign a hotkey to toggle the overlay on and off. Ctrl + Shift + F is a common choice. This lets you pull up the overlay during a demanding scene and dismiss it when you don’t need it.
One important note on CPU temperature in Afterburner: On some AMD AM4 and AM5 motherboards, and some Intel systems, Afterburner can’t read CPU temperature directly because the board doesn’t expose those sensors to Afterburner’s hardware layer. If the CPU temperature shows as dashes (—) rather than a number, install HWiNFO64, launch it in Sensors-Only mode, find your CPU temperature row in the sensor list, right-click it, and select “Show value in OSD (RTSS).” RTSS will then display the CPU temperature from HWiNFO instead. This pairing is more reliable for Ryzen 7000/9000 series and Intel 13th/14th Gen systems than Afterburner’s built-in sensor reading.
What the Readings Actually Mean
Framerate (FPS) — The number of complete frames your GPU is delivering per second. This is the primary performance metric. Your target depends on your monitor’s refresh rate a 144Hz monitor benefits from 144+ FPS. Below 60 FPS in most titles starts to feel noticeably less smooth. Below 30 FPS is genuinely uncomfortable for fast gameplay.
Frametime — This is the metric most players overlook, and it’s more important than raw FPS for how a game feels. Frametime measures how long each individual frame takes to render, in milliseconds. At a steady 100 FPS, every frame should take approximately 10ms. If frames are being delivered consistently going through 10ms, 10ms, 10ms in gameplay feels smooth. If frametime spikes at 10ms, 10ms, 42ms, 10ms and you experience that as a visible stutter even if your average FPS counter looks fine. A game reporting 80 FPS average with heavy frametime variance feels far worse than a game reporting 65 FPS with completely consistent frametimes. Always watch frametime alongside FPS to understand why a game feels jerky even when the FPS number looks acceptable.
GPU Usage (%) — How much of your GPU’s compute capacity is being used by the game.
This number tells you what’s limiting your frame rate, If GPU usage sits at 95–99% during demanding scenes, the GPU is the bottleneck while it’s working as hard as it can. Increasing in-game quality settings won’t affect performance much at that point, but lowering them will give you more frames. If GPU usage sits consistently below 80–85% while your FPS is lower than you’d expect, something else is limiting the GPU — usually the CPU, occasionally the game engine itself.
GPU Temperature — The average temperature across the GPU die Understanding what’s normal requires knowing what type of GPU you have.
Normal gaming ranges:
- Nvidia RTX 20, 30, 40, 50 series desktop: 65–85°C under gaming load
- AMD RX 6000, 7000, 9000 series desktop: 65–85°C under gaming load
- Both brands laptop GPUs: can run 10–15°C higher than desktop equivalents due to compact thermal design
Up to 85°C is completely normal and within AMD and Nvidia’s designed operating range for desktop cards. A GPU hitting 82°C in a demanding game is working exactly as intended. The reading that should concern you is sustained temperatures above 90°C in a well-ventilated case that suggests either a cooling problem worth investigating (dust buildup, poor airflow, dried thermal paste), or the card is thermally throttling and reducing its own clock speed to manage heat.
Hotspot Temperature (Junction Temperature) — The single hottest point on the GPU die, not the average.
This reading consistently alarms people who see it without understanding what it is. It’s always higher than GPU Temperature will usually be 10–20°C higher on Nvidia cards, and 20–35°C higher on AMD RDNA 3 and RDNA 4 cards. A 100°C hotspot on an RX 9070 alongside a 75°C core temperature is AMD’s design operating normally, not a warning sign. AMD deliberately allows higher hotspot differentials to extract maximum sustained performance from the chip. Nvidia’s hotspot typically runs closer to the core temperature.
The hotspot reading matters when it’s climbing while the core temperature looks acceptable for that specific pattern can indicate poor airflow around the die, inadequate case cooling, or on GDDR6X cards (RTX 3090 and 4090) it reflects VRAM junction temperature rather than core temperature, which is a separate concern.
GPU Memory Used (VRAM) — How much of your GPU’s video memory is currently in use.
This is one of the most actionable readings in the overlay watch it in the most demanding scenes of a game and when character models are dense, texture quality is highest, and particle effects are active. If VRAM usage climbs above 90–95% of your card’s total capacity, the game starts streaming textures from system RAM over the PCIe bus, which causes the characteristic stuttering that gets misdiagnosed as a frame rate problem. The fix is dropping texture quality by one preset that’s it.
Cards and their limits to keep in mind:
- 8GB cards: hitting limits in some 2026 AAA titles at 1440p Ultra textures
- 12GB cards: comfortable at 1440p, some pressure at 4K with ray tracing
- 16GB cards: comfortable at 4K in current titles
CPU Usage (%) — How much of your CPU’s processing capacity is being used.
If CPU usage is consistently at 90–100% while GPU usage sits below 80%, you have a CPU bottleneck. The GPU is ready to render more frames, but the CPU can’t feed it game state and draw calls fast enough. The most common cause is a weak CPU paired with a strong GPU, or a game that’s particularly CPU-intensive (strategy games with large unit counts, open-world games with dense simulation).
Watch per-core CPU usage if you can add it to your overlay. Some games are poorly threaded and hammer one or two cores to 100% while leaving others mostly idle. That specific pattern is one core at 100% while others are low while it is a software bottleneck that no hardware upgrade fully resolves.
CPU Temperature (Package) — The overall temperature of the CPU die.
Normal gaming ranges:
- AMD Ryzen 9000 series: up to 95°C is within AMD’s specified maximum TJ Max. These chips are designed to run hot.
- AMD Ryzen 7000 series: similar, up to 95°C TJ Max
- AMD Ryzen 5000 series and older: throttle around 90–95°C
- Intel Core 12th/13th/14th Gen: TJ Max 100°C. Unlocked K-series chips regularly approach 90–100°C under full load — this is within Intel’s design spec
- Intel Core Ultra 200 series: check your specific chip’s TJ Max on Intel’s spec page
CPU temperatures that look alarming by GPU temperature standards are normal for modern processors. A Ryzen 9 9950X at 90°C under gaming load is operating correctly. If temperatures are consistently at or above TJ Max and you’re experiencing clock speed drops, the cooler is insufficient for the workload.
What a Problem Actually Looks Like
Normal system behaviour described above will account for most readings most players see. Here’s what genuinely abnormal looks like, so you can distinguish a real problem from expected operation.
Thermal throttling: The most clearly visible symptom in an overlay is GPU or CPU clock speed dropping during a demanding scene while usage stays high. Open GPU-Z’s Sensors tab or HWiNFO64 and watch core clock speed under load. If it drops 100–200MHz during heavy scenes while GPU usage stays at 98–99%, the GPU is reducing its own speed to avoid exceeding its thermal limit. HWiNFO64 has a dedicated “Thermal Throttle” flag that lights up when this happens this makes it unambiguous.
VRAM overflow: VRAM usage at or above 95–100% of capacity combined with stuttering Not fps drops or stuttering. The texture streaming across PCIe bus produces a stutter pattern distinctly different from frame rate drops. Fix: reduce texture quality one preset.
CPU bottleneck: GPU usage consistently below 80% while FPS is lower than expected and CPU usage is high. Check per-core usage one core at or near 100% is a threading bottleneck, all cores elevated is a general CPU limitation.
Artifacting: Visual glitches are flickering textures, wrong-coloured pixels, geometry corruption. These can indicate overheating VRAM, failing GPU hardware, or driver corruption. Check VRAM junction temperature in HWiNFO64 if your card exposes it. If temperatures are fine, a clean driver reinstall using DDU (Display Driver Uninstaller) eliminates driver corruption as the cause before assuming hardware failure.
Consistent FPS drops 15–20 minutes into a session that wasn’t present at launch: Classic thermal throttling pattern which is in the system starts cold, performance is good, thermals build up, the GPU or CPU starts reducing clock speeds to manage heat. Monitor temperature over a full gaming session rather than just checking at launch.
Quick Reference: What to Install and When
| Tool | When to use it |
|---|---|
| MSI Afterburner + RTSS | Always — daily monitoring overlay |
| HWiNFO64 | When Afterburner shows something unusual or can’t read a sensor |
| GPU-Z | Quick GPU spec check, verifying boost clock is working |
| CPU-Z | Verifying XMP/EXPO is active, checking RAM speed and timings |
You don’t need all four running simultaneously. MSI Afterburner covers day-to-day monitoring. The others are diagnostic tools you reach for when something needs investigation.
SpecClear participates in affiliate programmes. When you purchase through links on this site we may earn a commission at no additional cost to you.
Continue Reading: The Full Gaming Optimisation Series
This article is part of SpecClear’s complete PC gaming optimisation series. Work through all six guides to get the most out of your hardware.