
SpecClear earns a commission if you buy through Newegg links on this page, at no extra cost to you.
A PC that crashes is one of the most frustrating experiences in computing. The screen goes black, Windows restarts without warning, or a blue screen flashes past before the system reboots. The problem might have been building for weeks before it became obvious. And without knowing where to look, diagnosing it feels like guessing.
It isn’t guessing. Every crash leaves evidence. Windows logs the event. The blue screen records an error code. The system event log captures hardware failures. The tools to read this evidence are built into Windows and cost nothing to use. Once you have a likely cause, our guide to stress testing your PC helps confirm it.
This guide covers every crash type, where the evidence lives, how to read it, and how to identify whether the cause is RAM, GPU, PSU, overheating, driver corruption, or overclocking instability, the six causes behind the overwhelming majority of PC crashes in 2026.
The Three Types of PC Crash: What Each One Means
Before looking at logs, the type of crash narrows the cause significantly.
Blue Screen of Death (BSOD): Windows detected a critical error it couldn’t recover from and stopped the system to prevent data corruption. The blue screen displays a stop code, a string of text like MEMORY_MANAGEMENT or WHEA_UNCORRECTABLE_ERROR, that identifies the category of failure. BSODs are almost always software, driver, RAM, or overclocking related. They’re Windows telling you it caught a problem before it became worse.

Hard freeze: The system stops completely. Mouse doesn’t move. Keyboard doesn’t respond. Display is frozen on the last frame. Only a hard power-off (holding the power button) recovers it. Hard freezes are typically GPU, driver, or RAM related. They happen when a component stops responding and the operating system can’t gracefully shut down, it just stops.
Random restart: The PC shuts off and immediately restarts without warning, exactly as if someone pressed the reset button. No blue screen, no freeze, just instant off and on. Random restarts are typically PSU, power delivery, or thermal related. When the CPU or GPU hits a thermal protection threshold, or when the PSU can’t supply sufficient stable power, the system cuts power immediately as a protection mechanism. To rule out heat, check your numbers with our temperature monitoring guide.

Understanding which type you’re experiencing immediately rules out a third of potential causes.
Step 1: Check Windows Event Viewer
Every crash event is logged in Windows Event Viewer regardless of whether a blue screen appeared. This is your first stop for any crash investigation.
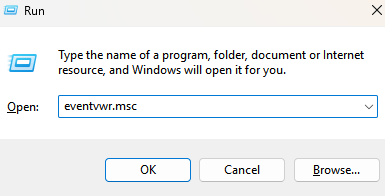
Open Event Viewer: press Windows + R, type eventvwr.msc, press Enter. In the left panel, expand Windows Logs → System. Look for red Error entries or yellow Warning entries around the time of your last crash.

Look specifically for these Event Viewer entries:
Event ID 41: Kernel-Power: This event is logged every time the system shuts down unexpectedly, without Windows initiating a proper shutdown. If you see Event ID 41 after a random restart, the system cut power abruptly rather than shutting down gracefully. This is the signature of a PSU problem, a thermal shutdown, or a hard freeze that required a forced power-off. Expand the event and look at the Bugcheck Code field, if it shows 0, the system restarted without generating a blue screen error, which points toward power or thermal causes rather than software.
Event ID 1001: BugCheck: This is logged alongside a BSOD. It contains the stop code and memory address that caused the crash, the same information that appeared on the blue screen, but logged permanently so you can read it after the system restarts.
Event ID 4621: System Restore: Logged when Windows completes a crash recovery. Less useful for diagnosis but confirms a crash event occurred.
After locating the relevant events, note the timestamp, the event ID, and any error codes listed. These are your primary diagnostic data.
Step 2: Reading Blue Screen Stop Codes
If you experienced a BSOD, Windows saves a memory dump file that contains the complete state of the system at the moment of the crash. Before examining the dump, the stop code itself narrows the cause.
MEMORY_MANAGEMENT: Almost always RAM. Can indicate failing RAM, RAM running at unstable XMP/EXPO settings, incompatible RAM configuration, or incorrect voltage. First action: disable XMP/EXPO and test at default JEDEC speed. If crashes stop, the RAM is running at an unstable speed for your specific board or chip combination.
WHEA_UNCORRECTABLE_ERROR: Hardware error that Windows couldn’t correct. Common causes: unstable CPU overclock, unstable RAM, CPU voltage too low for the operating frequency, degraded CPU. If you’ve recently changed any BIOS settings, clear CMOS and test at defaults. If the error appears on a completely stock system, it may indicate a hardware fault, contact the manufacturer.
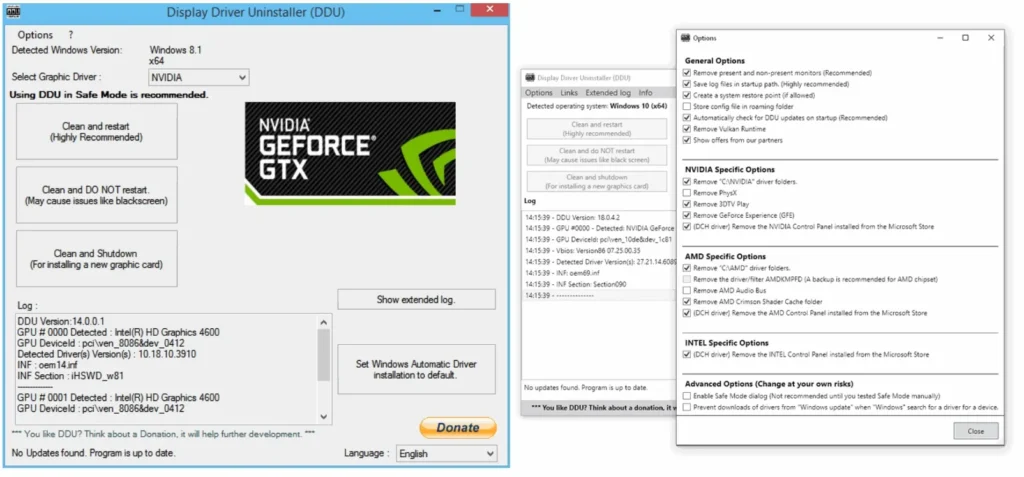
VIDEO_TDR_FAILURE or VIDEO_DXGKRNL_FATAL_ERROR: GPU driver crash. The display driver stopped responding and couldn’t recover. Common causes: unstable GPU overclock, corrupted GPU driver, failing GPU. First action: use DDU (Display Driver Uninstaller) to completely remove the GPU driver, then install a clean copy of the latest stable driver. If the crash was preceded by an overclock, reset the overclock to stock.
PAGE_FAULT_IN_NONPAGED_AREA: Can be RAM, storage, or software. Run MemTest86 to rule out RAM. Run CHKDSK on your Windows drive to check for file system errors.
CRITICAL_PROCESS_DIED: Windows core process stopped unexpectedly. Usually software or driver related rather than hardware. Run System File Checker (open Command Prompt as administrator, type sfc /scannow) to check for corrupted Windows system files.
DRIVER_IRQL_NOT_LESS_OR_EQUAL: A driver tried to access memory it shouldn’t have. Almost always a specific driver is responsible. The blue screen usually names the driver file, look for a filename ending in .sys on the blue screen or in the Event Viewer crash log.
Step 3: Analysing the Memory Dump with WinDbg
For persistent crashes where the stop code doesn’t immediately identify the cause, Windows memory dump files contain complete diagnostic information that WinDbg can read.

Download WinDbg from the Microsoft Store (free). Open it and go to File → Open Dump File. Navigate to C:\Windows\Minidump: this folder contains .dmp files from each BSOD. Open the most recent one.
In WinDbg, type !analyze -v in the command window at the bottom and press Enter. WinDbg analyses the dump and produces a detailed report. Look for:
- Probably caused by: The file WinDbg thinks is responsible, usually a driver
.sysfile orntoskrnl.exe(Windows kernel itself) - STACK_TEXT: The call stack at the moment of the crash, a list of what the system was doing when it failed
If the analysis points to a third-party driver (a .sys file that isn’t a Windows system file), identify which application or hardware it belongs to by searching the filename. Updating or uninstalling that driver is often the complete fix.
If the analysis points to ntoskrnl.exe or another Windows system file, the cause is more likely hardware (RAM, GPU) than software.
Step 4: Testing RAM with MemTest86
RAM is responsible for a large proportion of PC crashes and the symptoms look identical to GPU, driver, and software failures. Testing it early saves hours of chasing the wrong cause.

Download MemTest86 from memtest86.com (free). Write it to a USB drive using the included image writer. Boot from the USB drive, you may need to enter the BIOS boot menu (usually F8, F12, or F11 during POST) to select the USB as the boot device.
MemTest86 runs before Windows loads and tests the physical RAM. Let it complete at least two full passes, each pass takes 30-90 minutes depending on RAM capacity. Any errors, shown as red lines in the results, indicate RAM that’s either failing or running at unstable settings.
If MemTest86 finds errors at stock JEDEC speeds, the RAM itself may be failing, contact the manufacturer for warranty replacement. If errors only appear with XMP/EXPO enabled, try a lower speed profile or manually tighten timings more conservatively.
Test RAM sticks individually if errors appear. Remove all sticks except one, run MemTest86, then swap to the other stick. This identifies whether one specific stick is the problem or both are affected.
Step 5: GPU Crash Diagnosis
GPU-related crashes produce specific symptoms: visual artefacts before the crash (flickering, coloured pixels, screen tearing), crashes specifically during GPU-intensive tasks, and VIDEO_TDR_FAILURE stop codes.
DDU: the first GPU fix to try: Download Display Driver Uninstaller from Guru3D (free, highly trusted). Boot into Windows Safe Mode (hold Shift while clicking Restart → Troubleshoot → Advanced Options → Startup Settings → Safe Mode). Run DDU and select Clean and Restart. After rebooting normally, install the latest stable GPU driver fresh. Corrupt driver installations cause a significant proportion of GPU crashes and DDU eliminates them completely.
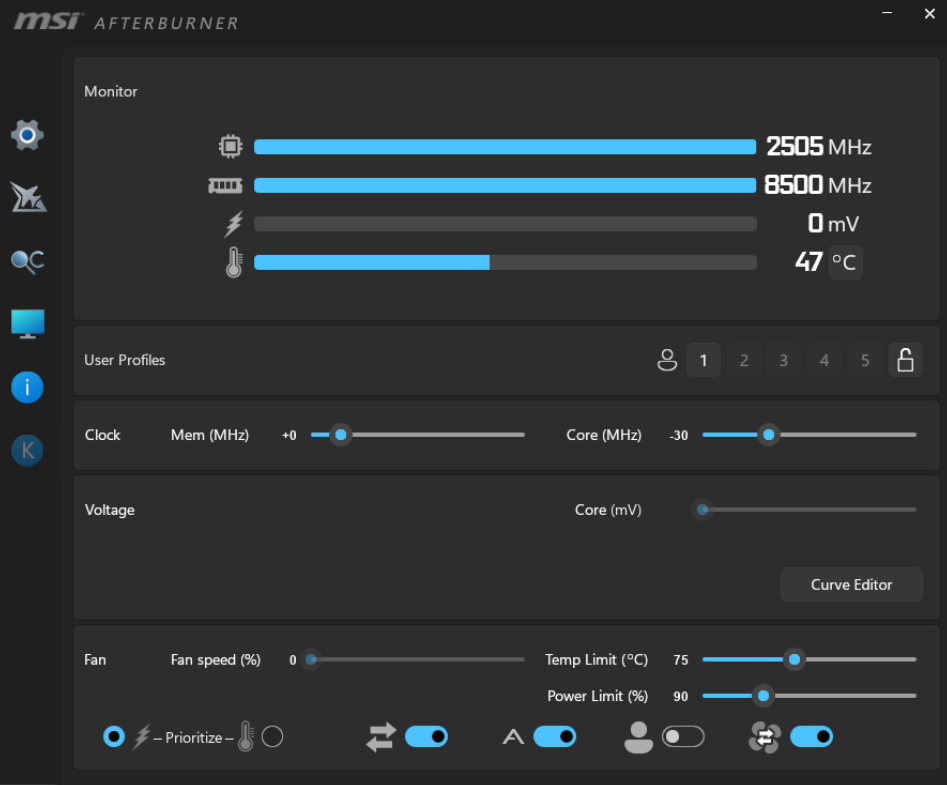
Test with stock clocks: If you have any GPU overclock applied through MSI Afterburner or AMD Adrenalin, reset everything to stock. An unstable overclock is one of the most common GPU crash causes and the first thing to rule out.
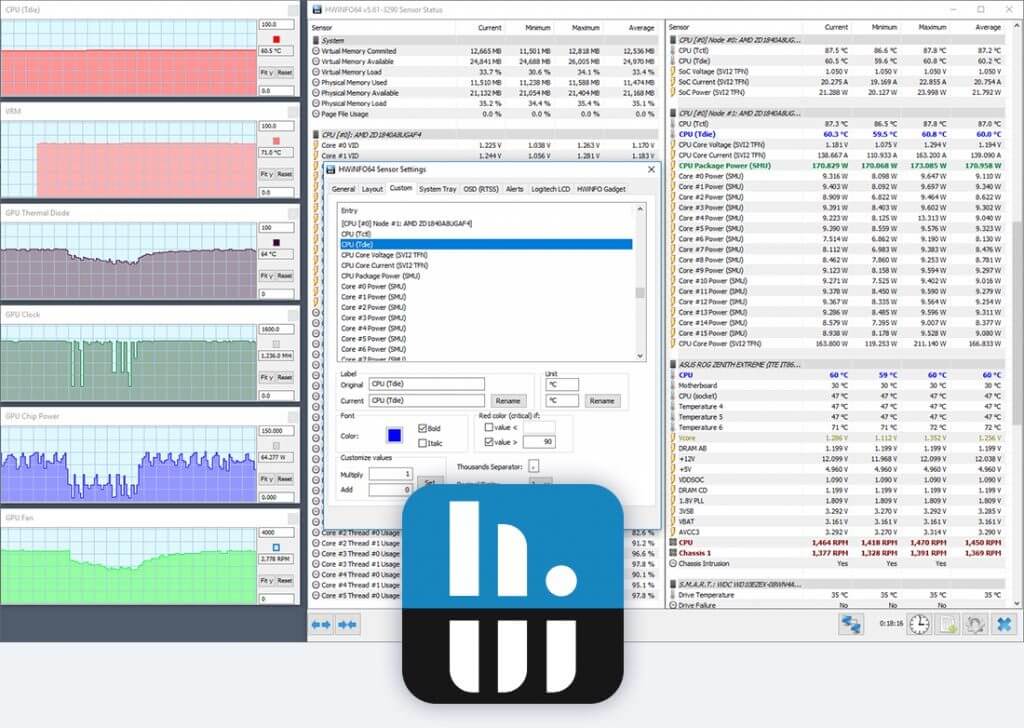
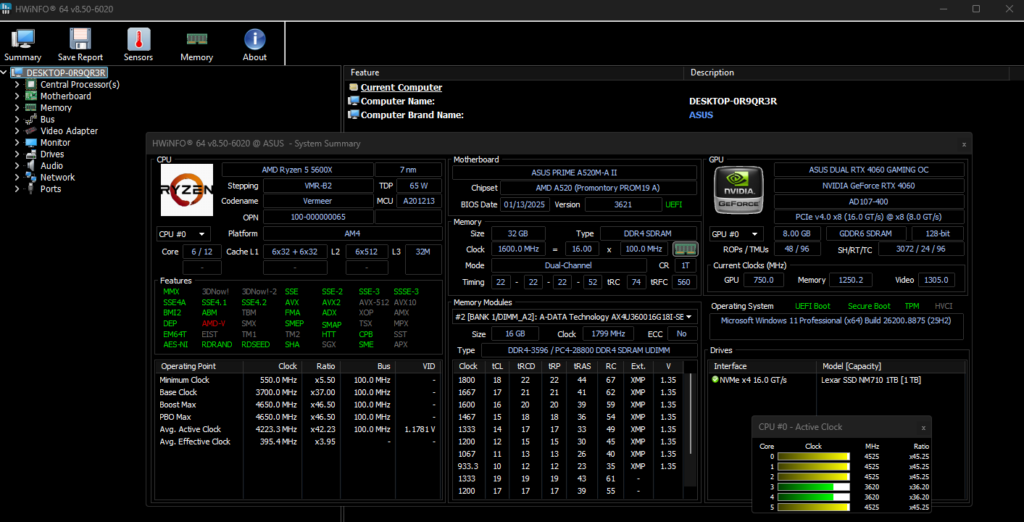
Check GPU temperatures under load: Run HWiNFO64 while gaming or running a GPU stress test. If the GPU junction temperature (AMD) exceeds 100°C or the GPU core temperature (Nvidia) exceeds 87°C consistently, thermal throttling or thermal protection is causing the crashes. Clean the GPU heatsink, improve case airflow, or repaste the GPU.
Reseat the GPU: Power off, remove the GPU from the PCIe slot, clean the gold contacts with isopropyl alcohol, and reseat it firmly until the PCIe retention clip clicks. A partially seated GPU causes intermittent crashes under load that look identical to driver or overclocking issues.
Step 6: PSU Crash Diagnosis
PSU problems are the hardest crashes to diagnose because they don’t leave obvious error codes. Event ID 41 with a Bugcheck Code of 0 is the strongest indicator, the system cut power without generating a Windows error first. If the PSU might simply be too small for your parts, check it with our wattage calculator.
PSU crashes typically occur under sustained heavy load, when both CPU and GPU are running at maximum simultaneously. Gaming triggers it more often than desktop use because gaming is the scenario where total system power draw peaks. Seasonic Focus GX-850 ($180)

Signs pointing to a PSU cause:
- Crashes happen specifically during GPU-intensive gaming, not during CPU-only workloads
- The system restarts instantly with no blue screen and no freeze, just instant off and on
- Crashes become more frequent as the room temperature rises (hotter ambient temperature means the PSU runs less efficiently)
- Event ID 41 with Bugcheck 0 in Event Viewer
Testing a PSU: Without specialised equipment, full PSU testing is difficult. The most practical approach is borrowing a known-good PSU of adequate wattage and swapping it into the system. If crashes stop, the original PSU is the cause. If this isn’t possible, check whether the PSU’s fan is spinning under load and whether the PSU is making any unusual sounds, a failing PSU may buzz or whine under load.
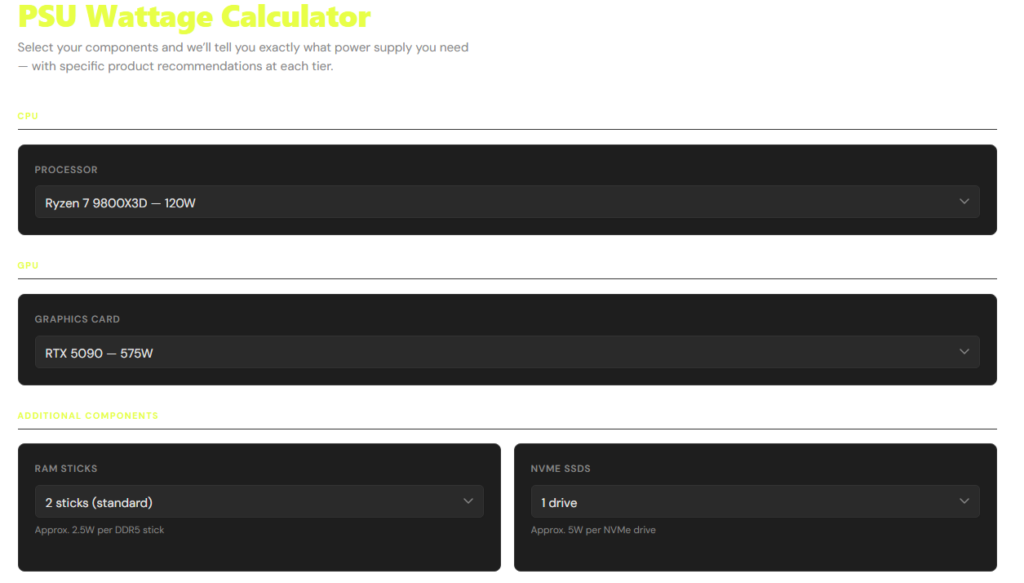
Run the SpecClear PSU Wattage Calculator to confirm your PSU has adequate headroom for your components. A PSU running at 90%+ of its rated capacity has no headroom for power spikes, adding 20% headroom is the standard recommendation for crash-free operation.
Step 7: Overclocking Instability
If you’ve recently changed any CPU, GPU, or RAM settings and crashes started afterward, the overclock is almost certainly the cause. Don’t spend time investigating drivers, RAM failure, or PSU issues before testing at stock settings first.
Clear CMOS (remove the CMOS battery or short the CLRTC pins on the motherboard) to reset all BIOS settings to factory defaults. This removes every CPU power limit change, RAM speed setting, and frequency offset simultaneously. Boot and test for 24 hours. If crashes stop, the overclock was unstable.
Re-apply settings one at a time with stability testing between each change. Start with XMP/EXPO. Test for an hour. Enable PBO. Test for an hour. Add Curve Optimizer. Test overnight. This incremental approach identifies exactly which setting is causing instability rather than guessing.
The Diagnostic Order: Work Through This Sequence
To avoid chasing the wrong cause, follow this order:
- Check Event Viewer for crash type and event IDs. Note whether it’s BSOD (Event ID 1001), instant restart (Event ID 41 with Bugcheck 0), or freeze.
- Reset overclocks to stock if any exist. This rules out the most common and most reversible cause immediately.
- Update GPU drivers using DDU clean install. GPU driver corruption is the second most common cause of crashes.
- Run MemTest86 for two passes. RAM errors produce crashes identical to every other hardware failure, rule it out early.
- Check temperatures under load with HWiNFO64. GPU and CPU temperatures above the thresholds in the GPU overclock guide indicate thermal shutdowns.
- Check the PSU if crashes survive all of the above and specifically occur under heavy load. The PSU calculator provides a wattage check. Borrowing a known-good PSU rules it in or out definitively.
- Run Windows SFC if all hardware checks pass. Software corruption affects fewer systems but is a complete fix when it is the cause.